Your AI Agents Are Running in Production. Who's Watching the Limits?
Part of: AI Agent Risk & Blast Radius Reference — the full pillar covering action authority, risk scoring, blast-radius containment, and degradation paths.
Every team building AI agents eventually adds budget limits. Some add risk scoring. You set up a governance layer — cost caps per tenant, risk point budgets per agent, overdraft policies for when things get tight.
Then it's 2am. An agent burns through its risk allowance. A tenant hits their spend ceiling mid-transaction. Your compliance webhook stopped receiving events three hours ago and nobody noticed.
You SSH into a box. You grep for the right curl command in the runbook. You try to remember if it's scope=tenant:acme/agent:primary or scope=tenant:acme/agents:primary. You get a 404. You check the spec. You try again. Meanwhile, Slack is on fire.
Governance systems need an operational surface. Not just APIs — a place where operators can see what's happening, decide what to do, and act on it. Without leaving the browser. Without remembering endpoint paths.
This post walks through three production scenarios we kept hitting, the pattern behind them, and how we built the operational surface for Cycles.
The pattern: read-only dashboards aren't enough
Most teams start with Grafana. You instrument your governance layer, build dashboards for budget utilization and denial rates, set up PagerDuty alerts. That covers the see part of the loop.
Then the alert fires, and you need to act. Credit more risk points. Freeze a scope. Revoke a key. Grafana can't do that — it's read-only. So you open a terminal.
Some teams go further and build a custom admin panel in Retool or an internal tool. That works until you need confirmation dialogs on destructive actions, one-time secret display for API keys, capability-gated buttons that hide based on permissions, or audit-grade export. You end up rebuilding half a governance UI from scratch, and maintaining it alongside the governance system itself.
The pattern we found: a governance operational surface has different requirements than a monitoring dashboard. It needs:
- Write actions with safety rails — confirmation dialogs, irreversibility warnings, name-match gates for destructive operations
- Secret lifecycle — one-time display, clipboard auto-clear, rotation without retrieval
- Resource-level audit — not just "what happened" but "what happened to this specific key in this time window"
- Capability gating — operators see only the actions their permissions allow
These are the properties we designed around. Here are three scenarios that exercise all of them.
Scenario 1: Agent burns through its risk budget
Your customer support agent hit its risk point ceiling. It's been making tool calls that score high on the risk scale — external API calls, database writes, email sends. The budget is at 85% utilization. Customers are starting to get fallback responses.
You need to see the situation, decide if the usage is legitimate, and either credit more risk points or freeze the scope before it gets worse.
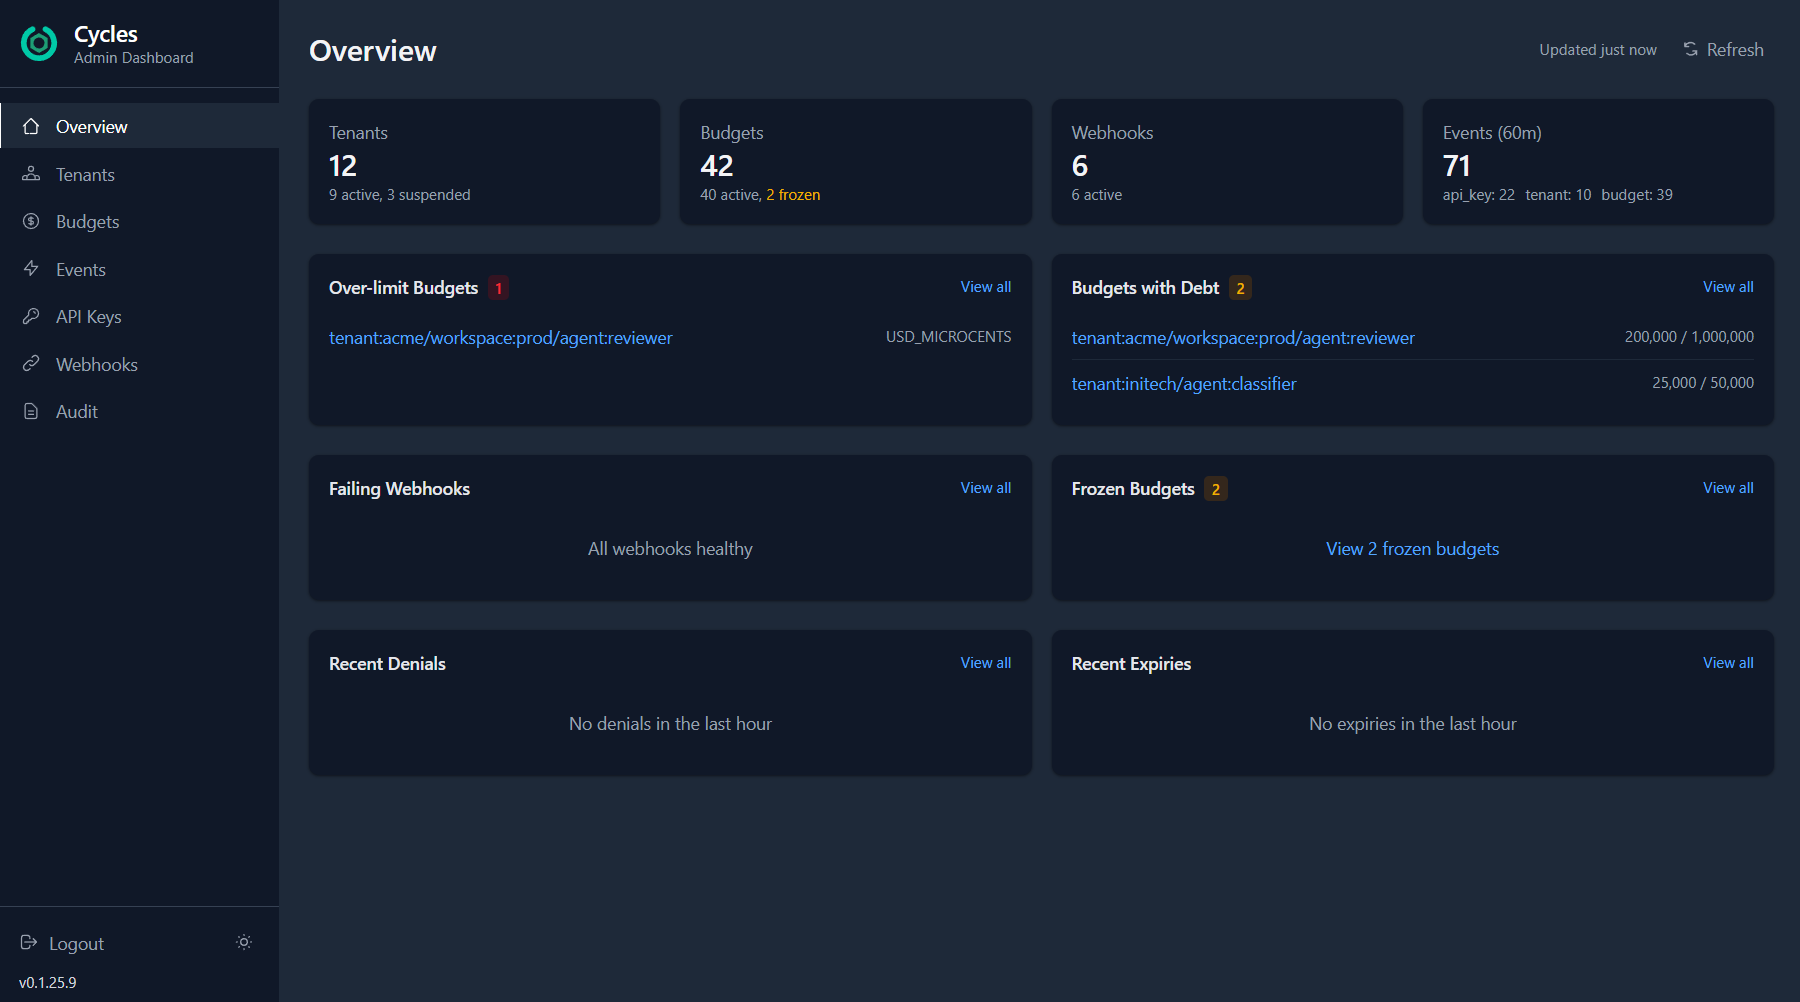
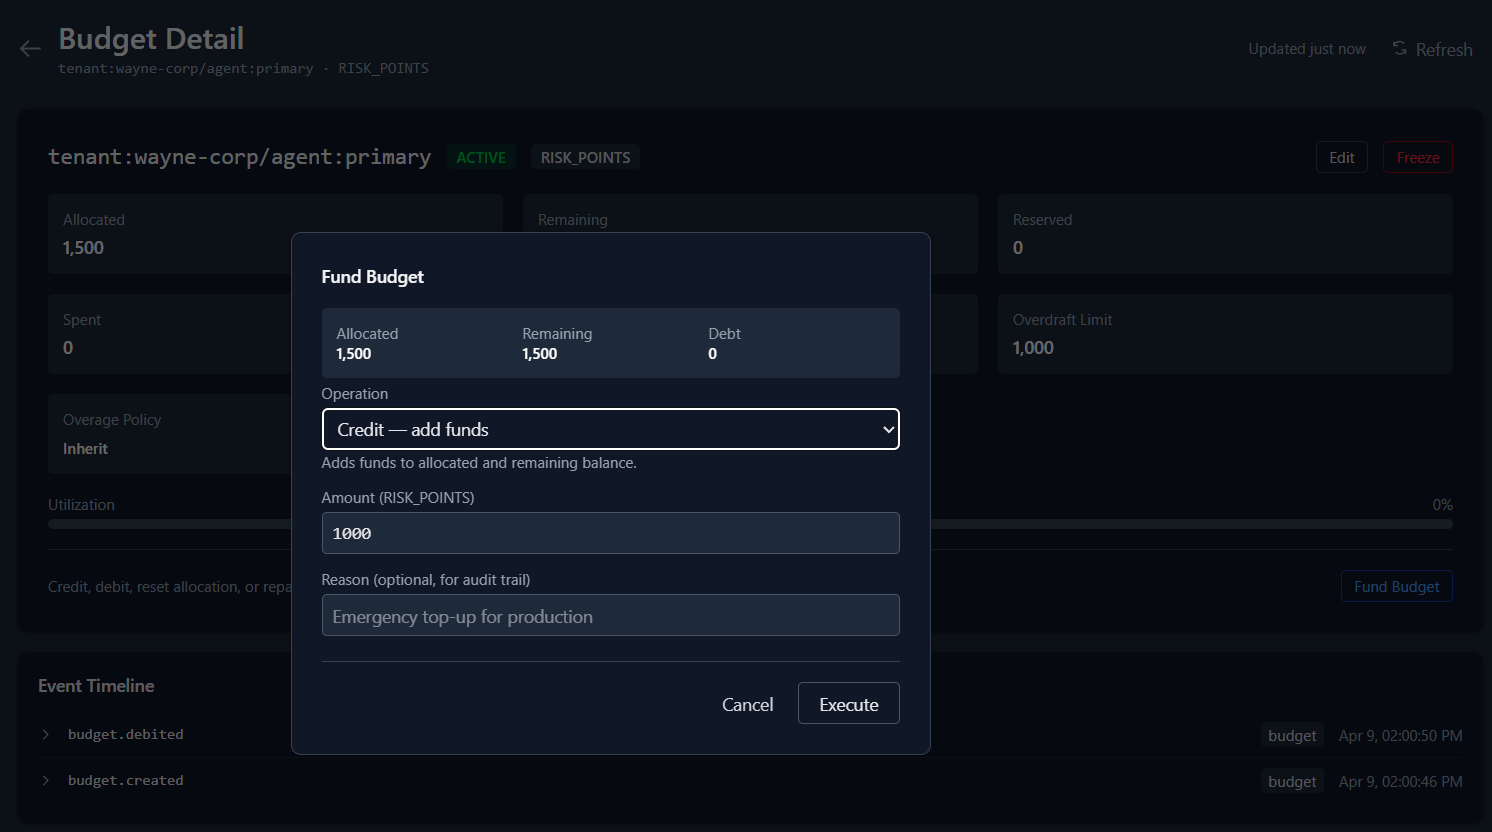
The overview surfaces it immediately: over-limit budgets, scopes with outstanding debt, and recent event activity across all tenants. You can see that tenant:wayne-corp/agent:primary is burning through RISK_POINTS — and drill straight into the budget detail.
From there, one click opens the fund dialog. Select Credit, enter the amount, add a reason for the audit trail. The budget is topped up and the agent resumes.
If the usage looks suspicious instead of legitimate? Click Freeze directly from the budget list. No detail page needed. The scope is locked immediately — new reservations and commits are blocked until you unfreeze it.
The same workflow applies to cost budgets — USD spend, token usage, credits. Whether you're capping dollars or risk points, the operational pattern is the same.
Scenario 2: Compromised API key
Your audit logs show unusual patterns — a burst of auth failures followed by successful operations from an IP you don't recognize. Someone may have a leaked key.
You need to revoke it immediately, provision a replacement, hand the new secret to the team, and verify the audit trail — all without a deploy.
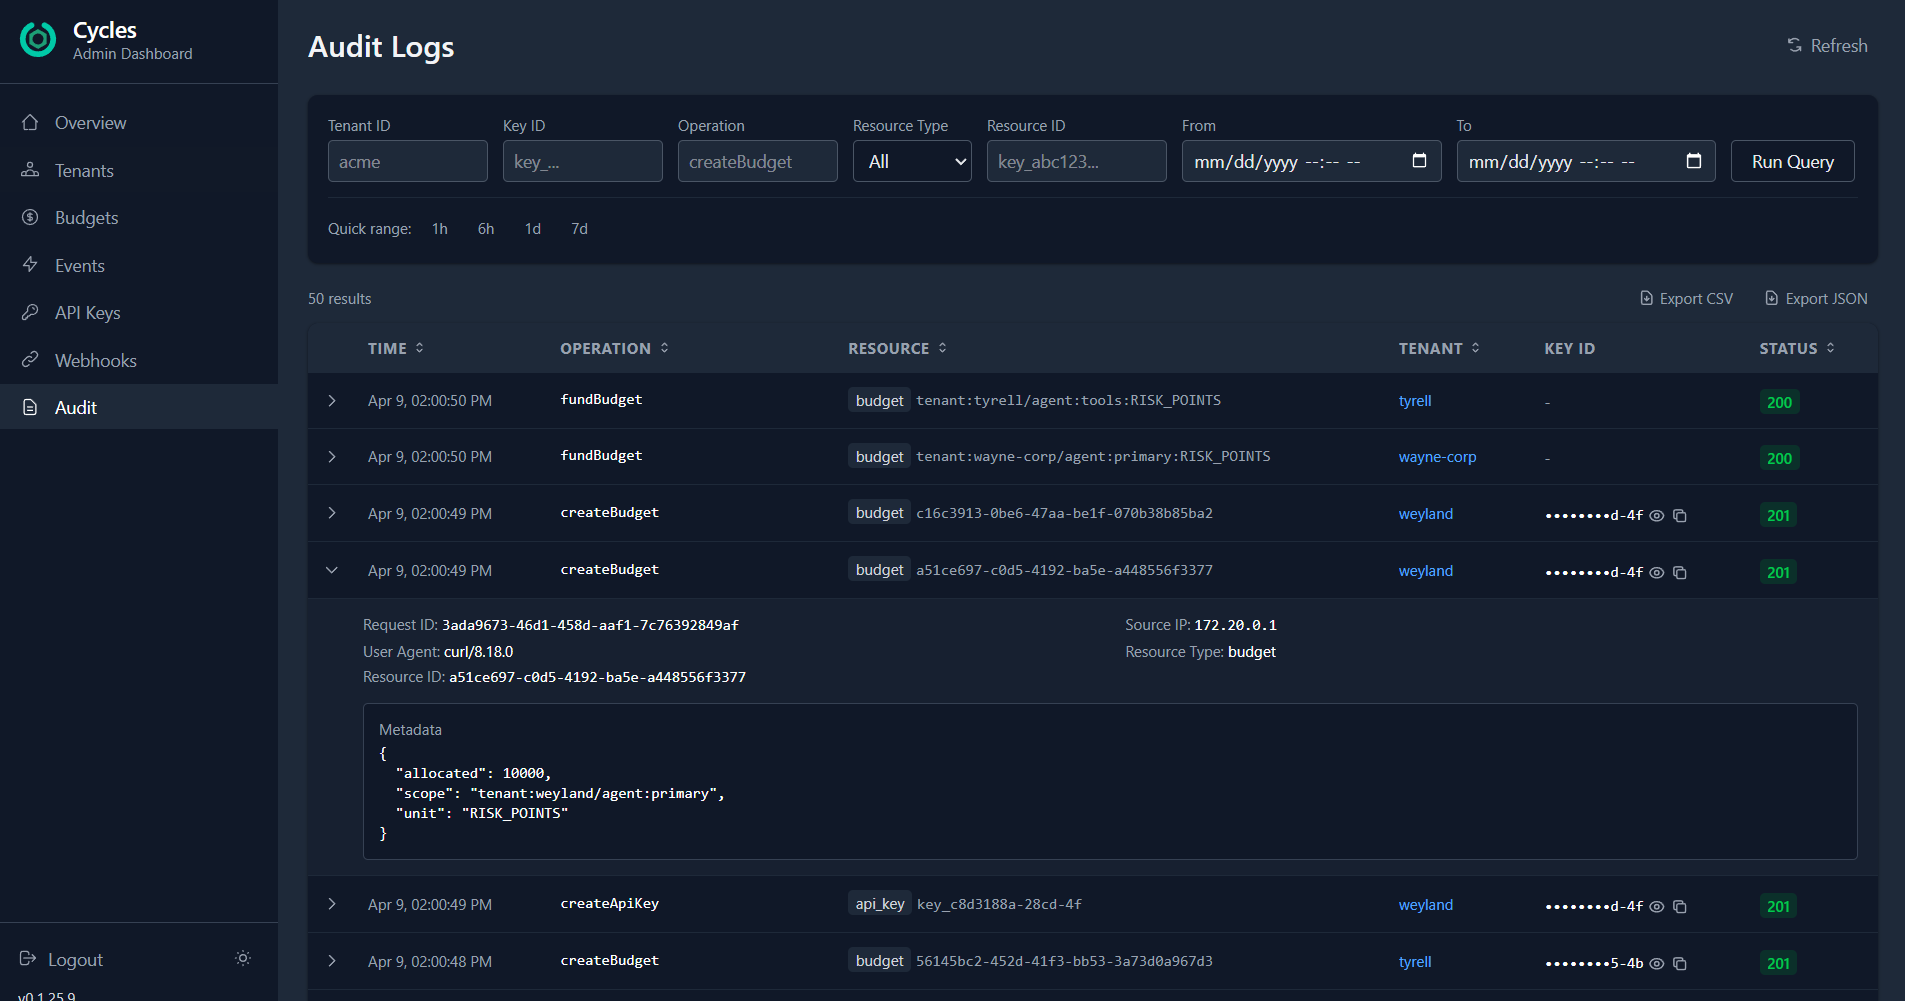
Filter audit logs by resource_type: api_key and the time window. Expand any row to see the full context: who did what, from which IP, with what parameters. The metadata shows the exact resource ID, operation, and request details.
Found the compromised key? Click Revoke on the API Keys page. It's invalidated instantly. New operations using that key stop immediately.
Now create a replacement. The new key secret is shown exactly once — copy it, confirm you've saved it, and the dialog closes. The secret is never stored in the dashboard or retrievable again.
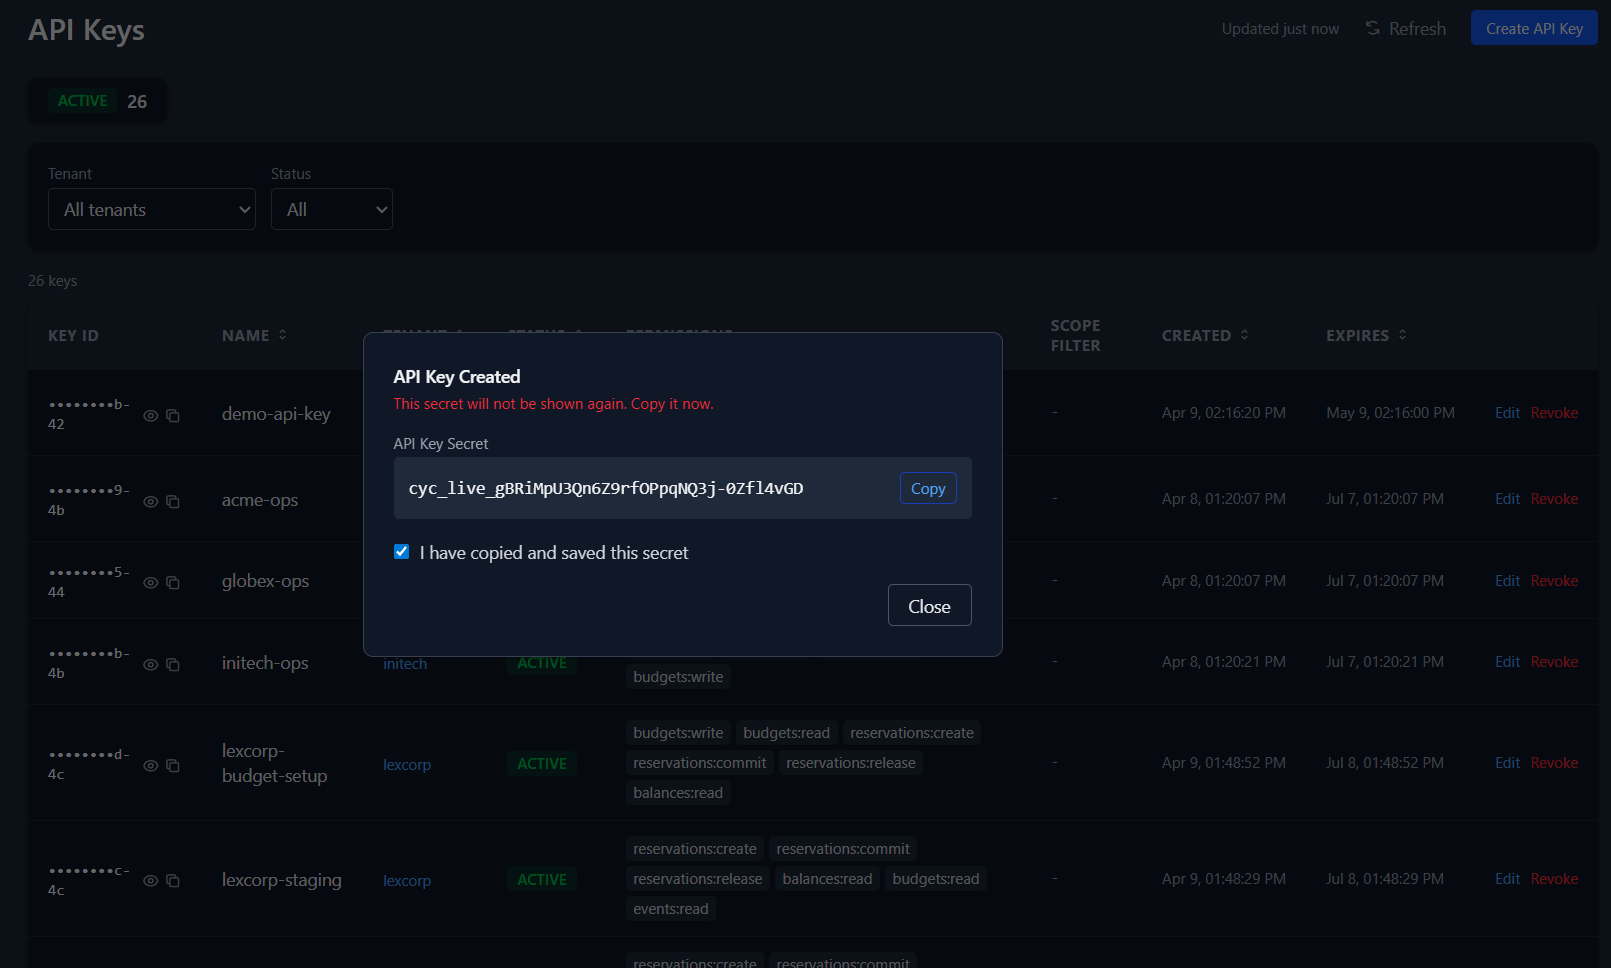
The secret is shown once, designed for immediate copy, then cleared from the UI flow. The entire rotation — revoke old, create new, copy secret — happens in the browser without touching a terminal.
Scenario 3: Webhook delivery failing silently
Your compliance audit sink stopped receiving events. You check the webhook detail: 2 pending deliveries, the endpoint returning errors. Your SOC2 auditor is going to ask about the gap.
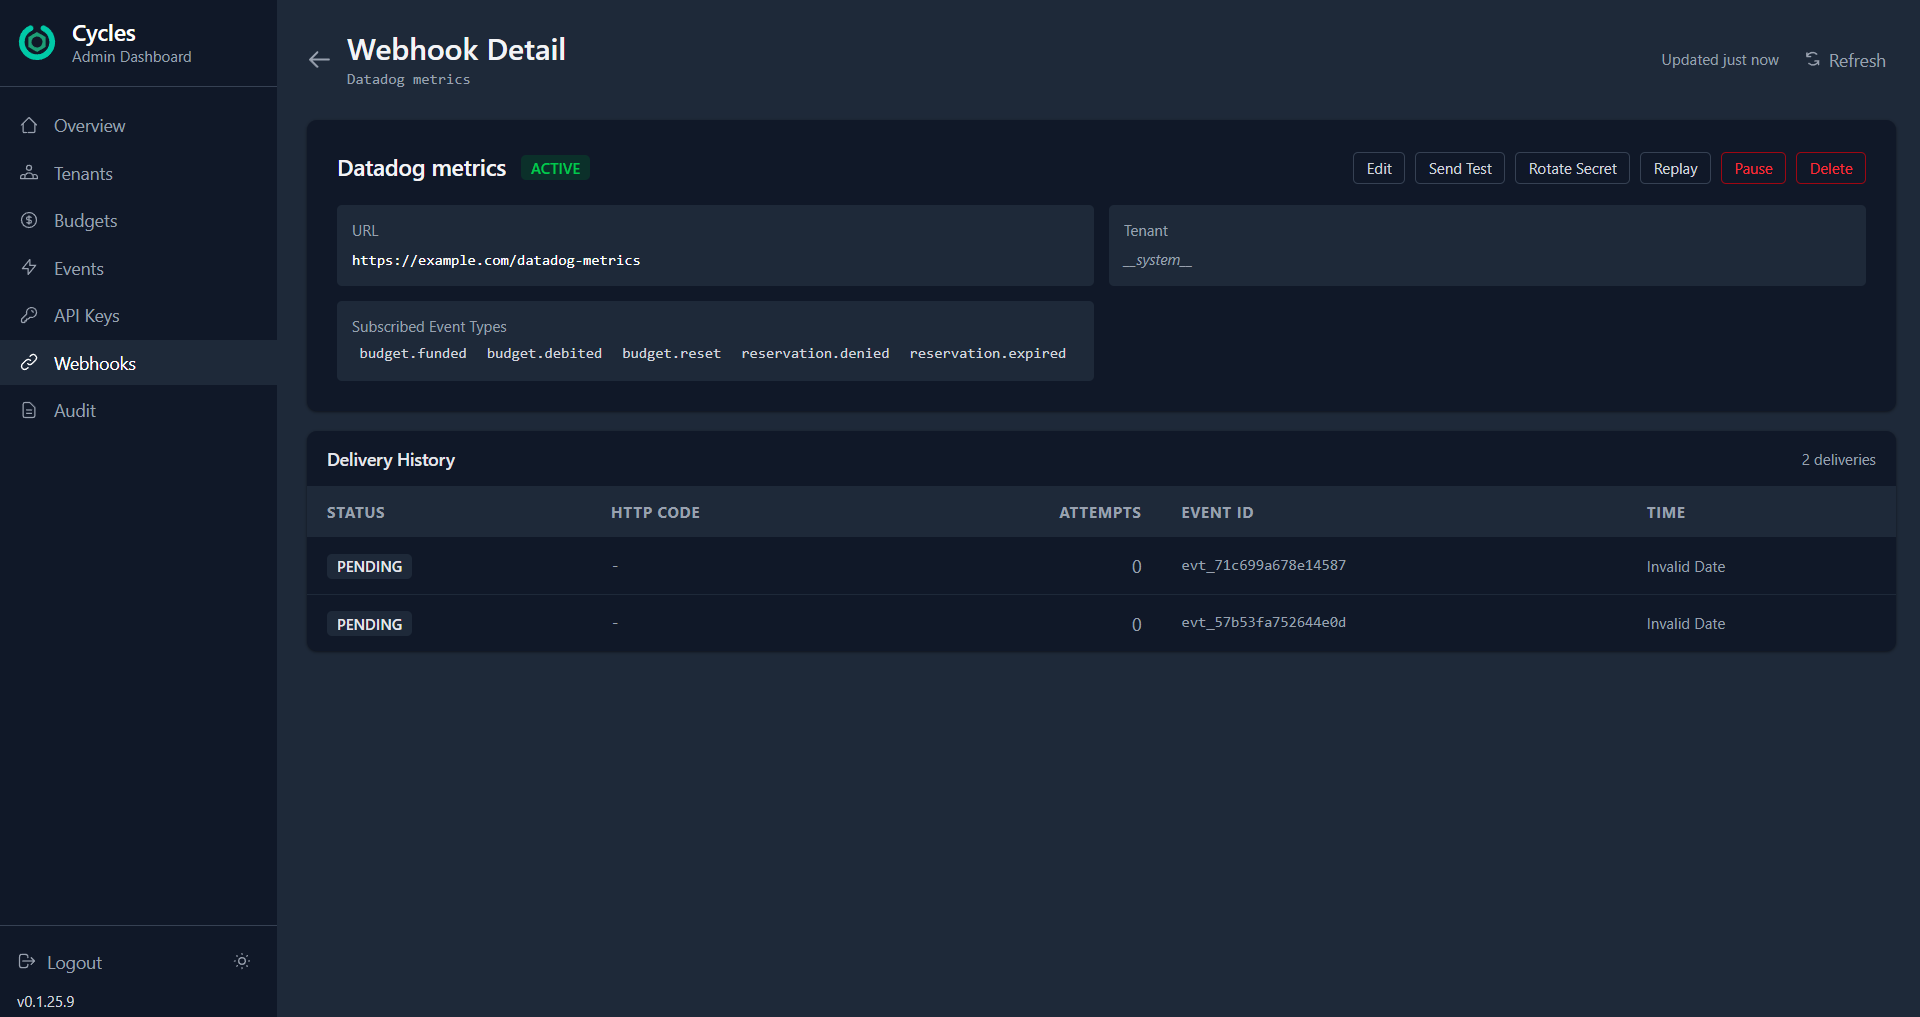
The webhook detail page gives you everything in one view: the URL, subscribed event types, delivery history, and a row of action buttons. Send Test to verify connectivity — you'll see the HTTP status, response time, and error message inline. If the URL changed, click Edit to update it. Need a new signing secret? Rotate Secret generates a cryptographically strong one and shows it via the same one-time reveal pattern.
Once the endpoint is fixed, click Replay to re-deliver the events that were missed. Set the time window, hit execute, and the gap is closed.
If the webhook needs maintenance downtime, Pause it from the list view — events will be silently dropped rather than piling up failed deliveries. Enable it when you're ready.
What we learned building this
A few things surprised us.
Risk budgets and cost budgets need the same operational surface. Early on we treated risk points as a different category from USD or tokens. In practice, the operator workflow is identical: see utilization, decide to credit or freeze, log a reason. The unit type is metadata, not architecture. Our dashboard handles all four unit types (USD, tokens, credits, risk points) with the same components.
Destructive actions need more than a confirm button. For reversible operations like freeze, a standard confirmation dialog works. For irreversible ones like closing a tenant permanently, we adopted the GitHub pattern: the operator must type the tenant name before the button enables. The friction is the point — it eliminates "I thought I was clicking on the other one" incidents.
Audit filtering by resource ID changed how we investigate. Before we added resource_type and resource_id as server-side filters, operators had to query broadly and scan manually. Being able to say "show me everything that happened to key key_011005b2" makes incident investigation an order of magnitude faster.
Try it
The screenshots above show a demo environment with 12 tenants, 42 budgets across four unit types, 6 webhooks, and a full audit trail — representative of a mid-scale production deployment.
docker compose up -d   # starts admin server + Redis
npm run dev            # starts dashboard on localhost:5173
Login with your admin API key. Everything else is in the README.
The dashboard is open source, ships as a Docker image, and covers the core admin workflows in the Cycles governance spec.
If you're building a governance layer for your agents — whether you use Cycles or not — the pattern holds: your operators need write access with safety rails, not just read-only charts. Design for the 2am case, not the demo.